Weather Observation
Overview
Weather radar is used to observe precipitation (raindrops and snowflakes) within a radius of several hundred kilometers using radio waves (microwaves) emitted from a rotating antenna. The distance to precipitation can be determined from the time taken for waves to bounce back, and precipitation intensity can be gauged from the amplitude of the reflected waves (radar echo). Information on wind (radial velocity) in precipitation areas can also be obtained based on the Doppler effect in relation to reflected radio waves. The Japan Meteorological Agency (JMA) started updating its weather radars to dual polarization Doppler weather radars in March 2020. These transmit and receive horizontal and vertical waves simultaneously, and enable classification of cloud-borne precipitation types as well as precise determination of rain intensity.
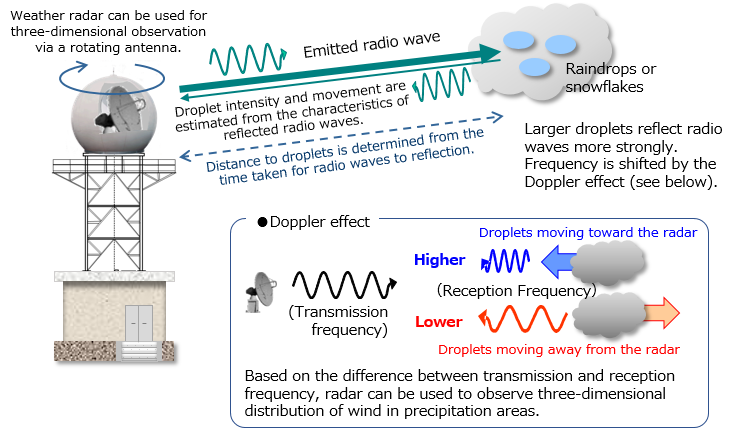
Overview of weather radar observation
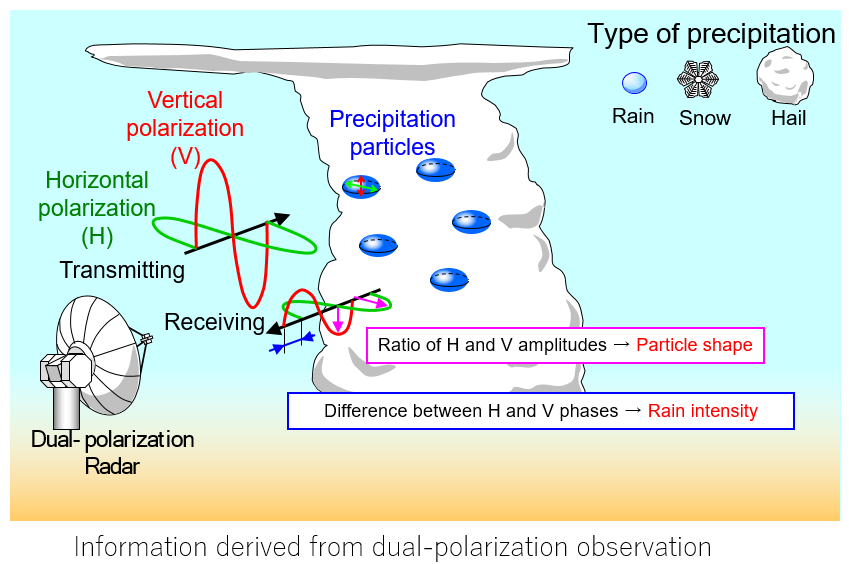
Information derived from dual-polarization observation
JMA has operated weather radars since 1954, and currently runs a nationwide network of 20 units. The observation data collected are utilized in real-time monitoring for disaster prevention and in the generation of initial values for use in very-short-range forecasting.
Weather Radar Observation Network
Radio waves travel in a straight line in air, and are unable to penetrate obstacles such as mountains. The curvature of the earth's surface also makes it difficult to observe precipitation at low altitudes, especially in areas far from radars. Accordingly, weather radars need to be located in high places such as on top of mountains or steel towers.
As Japan is a mountainous country, radar observation ranges depend on geographic location. In consideration of this situation, JMA’s weather radars are strategically placed to provide coverage for most of Japan and its vicinity.
| Region ID | Station | Location | Latitude (degree) |
Longitude (degree) |
Altitude above sea level (m) |
Altitude above ground level (m) |
Frequency (MHz) |
|---|---|---|---|---|---|---|---|
| 47415 | Sapporo | Mt. Kenashi-yama, Otaru-shi, Hokkaido | 43°08′20″ | 141°00′35″ | 749.0 | 49.0 | 5345.0 |
| 47419 | Kushiro | Konbumori, Kushiro-gun, Hokkaido | 42°57′39″ | 144°31′03″ | 121.6 | 24.1 | 5365.0 |
| 47432 | Hakodate | Mt. Yokotsu-dake, Kameda-gun, Hokkaido | 41°56′01″ | 140°46′53″ | 1141.7 | 30.4 | 5355.0 |
| 47582 | Akita | Akita Local Met. Office, Akita-shi, Akita | 39°43′04″ | 140°05′58″ | 55.3 | 49.8 | 5365.0 |
| 47590 | Sendai | Sendai Regional Headquarters, Miyagino-ku, Seidai-shi, Miyagi | 38°15′44″ | 140°53′50″ | 98.0 | 60.1 | 5365.0 |
| 47572 | Niigata | Mt. Yahiko-yama, Nishikanbara-gun, Niigata | 37°43′07″ | 138°48′58″ | 648.1 | 15.6 | 5345.0 |
| 47611 | Nagano | Mt. Kuruma-yama, Chino-shi, Nagano | 36°06′11″ | 138°11′45″ | 1937.1 | 12.4 | 5320.0 |
| 47695 | Tokyo | Meteorological College, Kashiwa-shi, Chiba | 35°51′35″ | 139°57′35″ | 74.0 | 55.0 | 5357.5 |
| 47659 | Shizuoka | Makinohara, Kikugawa-shi, Shizuoka | 34°44′34″ | 138°08′01″ | 186.0 | 29.8 | 5300.0 |
| 47636 | Nagoya | Nagoya Local Met. Office, Chikusa-ku, Nagoya-shi, Aichi | 35°10′05″ | 136°57′55″ | 73.1 | 22.0 | 5360.0 |
| 47705 | Fukui | Tojinbo, Sakai-shi, Fukui | 36°14′15″ | 136°08′32″ | 106.9 | 26.9 | 5350.0 |
| 47773 | Osaka | Mt. Takayasu-yama, Yao-shi, Osaka | 34°36′59″ | 135°39′23″ | 497.5 | 23.9 | 5350.0 |
| 47791 | Matsue | Mt. Misaka-yama, Matsue-shi, Shimane | 35°32′30″ | 133°06′13″ | 552.9 | 20.4 | 5345.0 |
| 47792 | Hiroshima | Mt. Haiga-mine, Kure-shi, Hiroshima | 34°16′13″ | 132°35′36″ | 751.5 | 17.9 | 5360.0 |
| 47899 | Murotomisaki | Murotomisaki Special Weather Observation Stations, Muroto-shi, Kochi | 33°15′09″ | 134°10′38″ | 207.0 | 24.0 | 5355.0 |
| 47806 | Fukuoka | Mt. Sefuri-san, Kanzaki-shi, Saga | 33°26′04″ | 130°21′25″ | 983.2 | 17.0 | 5365.0 |
| 47869 | Tanegashima | Nakatane, Kumage-gun, Kagoshima | 30°38′23″ | 130°58′45″ | 302.5 | 24.0 | 5365.0 |
| 47909 | Naze | Funcha-toge, Amami-shi, Kagoshima | 28°23′39″ | 129°33′07″ | 318.6 | 24.7 | 5350.0 |
| 47937 | Okinawa | Itokazu, Nanjo-shi, Okinawa | 26°09′12″ | 127°45′54″ | 208.4 | 21.9 | 5355.0 |
| 47920 | Ishigakijima | Mt. Omoto-dake, Ishigaki-shi, Okinawa | 24°25′36″ | 124°10′56″ | 533.5 | 17.5 | 5350.0 |
(Latitude and longitude coordinates conform to the World Geodetic System.)
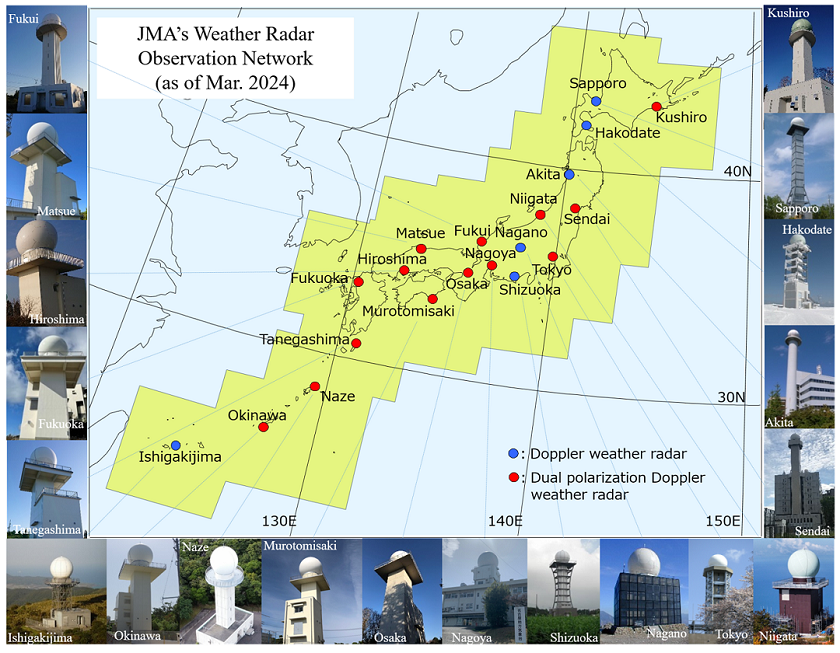
JMA's Weather Radar Observation Network (as of July 2025)
Examples of Weather Radar Data
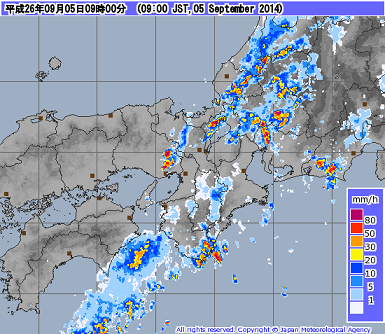
Cold front (9:00 JST, 5 September 2014)
The figures below show precipitation intensity based on radar observation along with a related weather map and a satellite image of a cold front heading southward along the Japanese archipelago. Linear echoes are observed from northern to western Japan, and significantly developed echoes are also seen in places (displayed in red and other warm colors). As convective clouds tend to develop near cold fronts, attention should be paid to the possibility of sudden heavy rain, gusting winds, lightning and tornadoes.
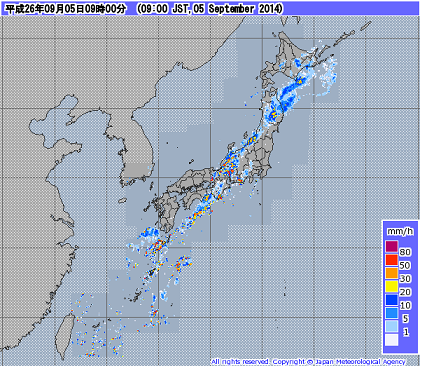
Radar observation (Nationwide)
Radar observation (Kinki area)
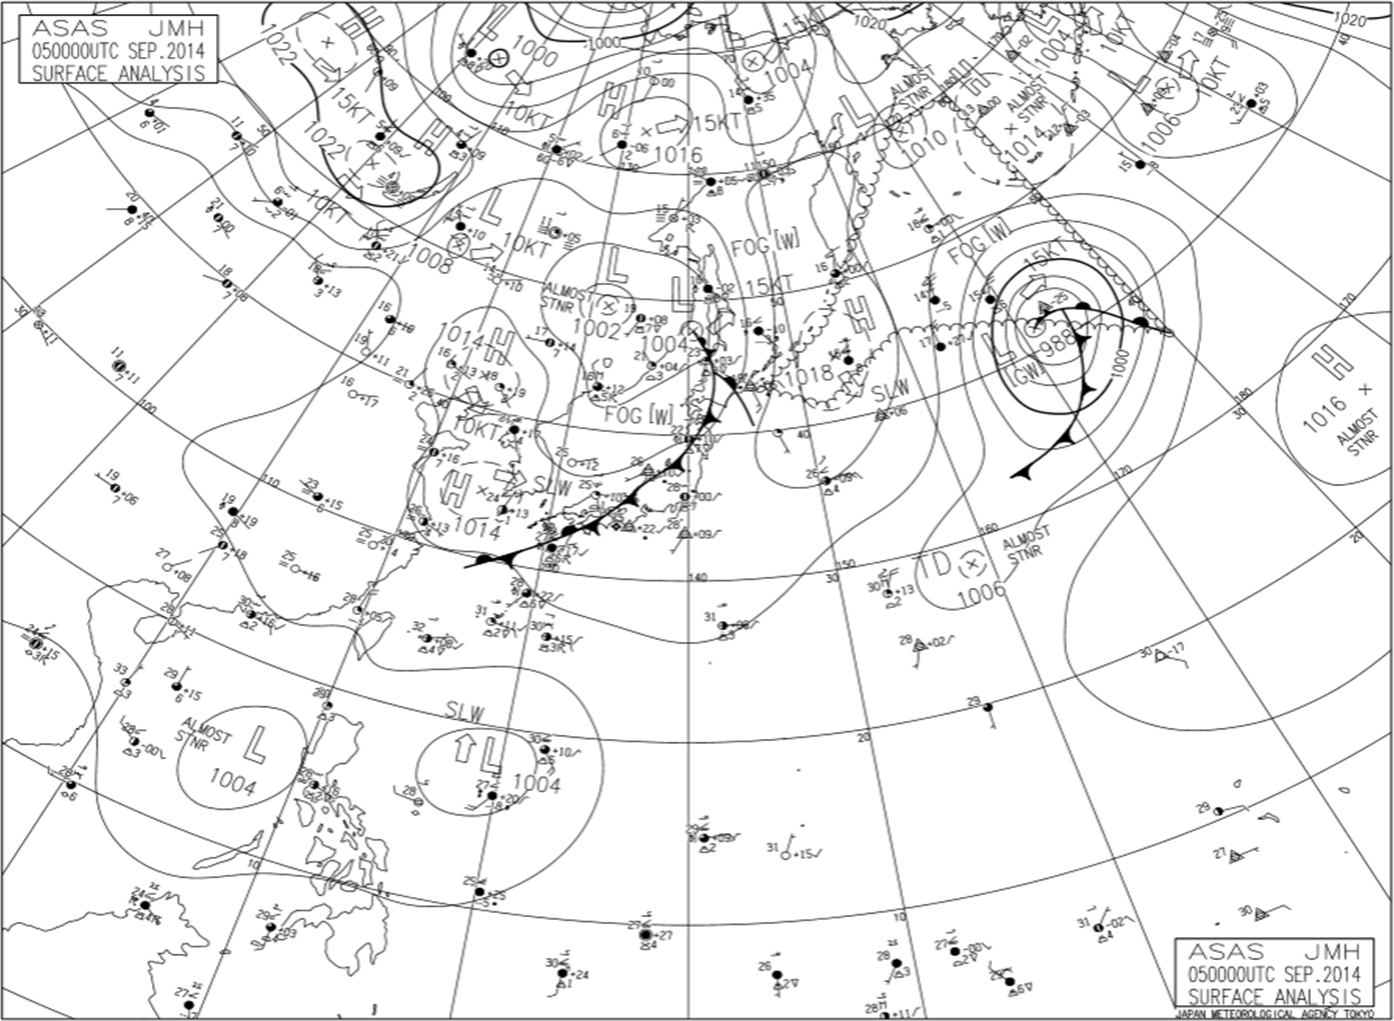
Weather map
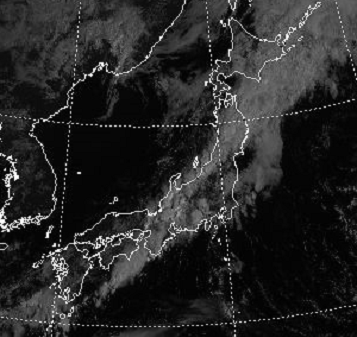
Satellite image
Rain and gusting winds (15:00 JST, 20 July 2014)
The figures below show radar echoes along with a related weather map and a satellite image of convective clouds caused by a large temperature difference between the lower and upper atmosphere due to solar radiation. Significantly developed echoes are observed locally (displayed in red and other warm colors). The appearance of such echoes indicates the possibility of severe weather conditions such as sudden heavy rain, gusting winds, lightning and tornadoes. Significantly developed convective clouds may bring hail even in midsummer.
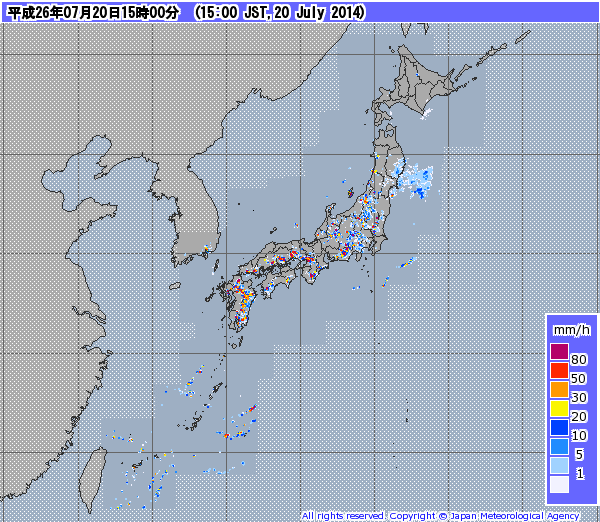
Radar observation (Nationwide)
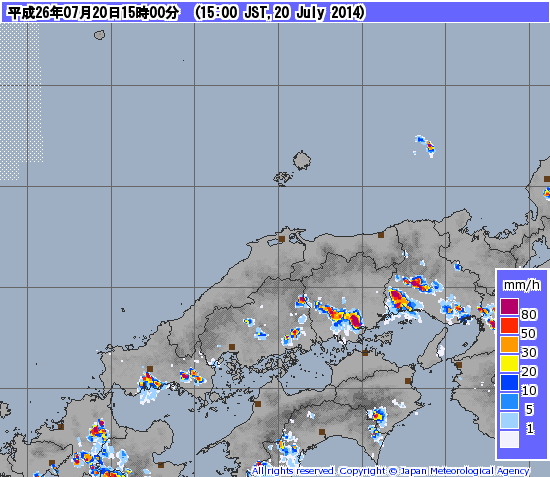
Radar observation (Kinki area)
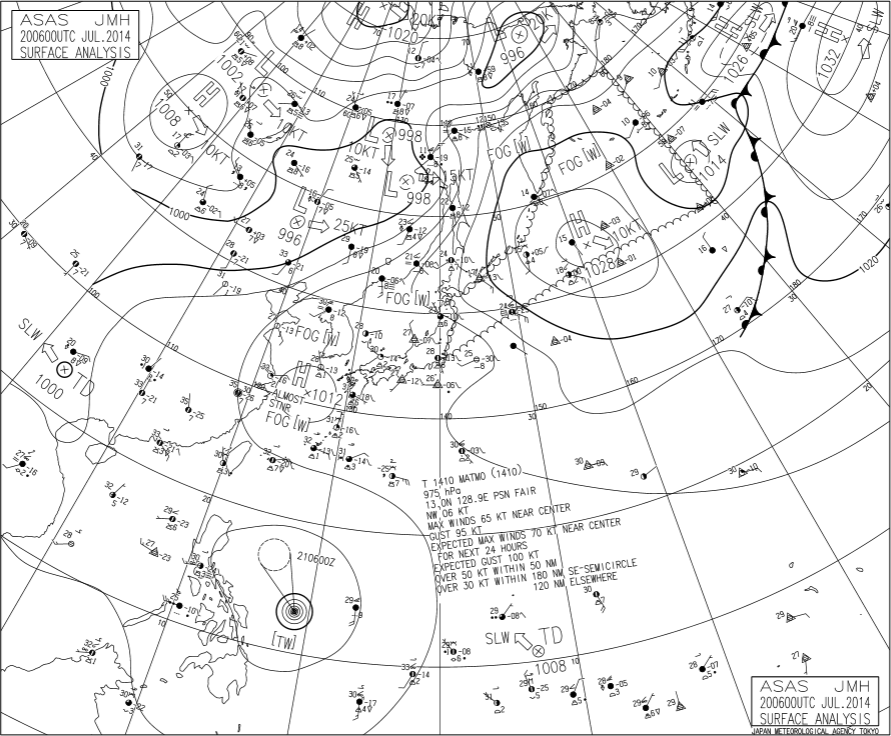
Weather map
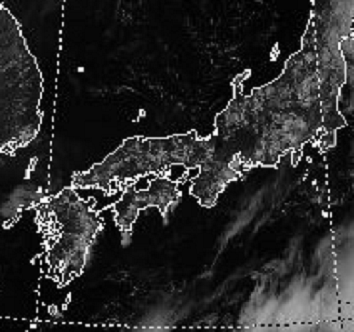
Satellite image
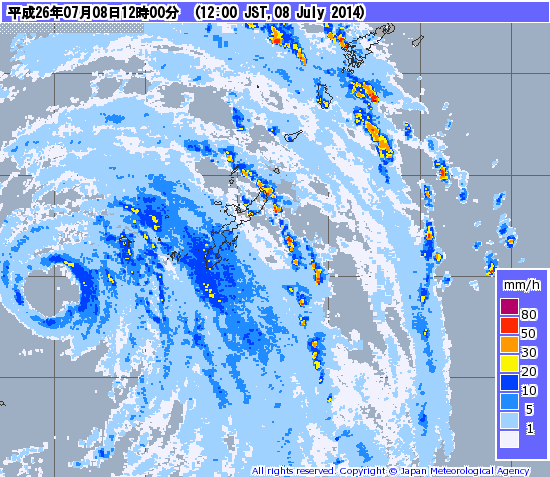
Typhoon (12:00 JST, 8 July 2014)
The figures below show radar echoes along with a related weather map and a satellite image of a typhoon (tropical cyclone) approaching Japan. Its eye can be seen in the center of the spiral echoes. In the vicinity of the typhoon, careful attention should be paid to the possibility of severe stormy conditions such as heavy rain, high waves, storm surges and lightning.
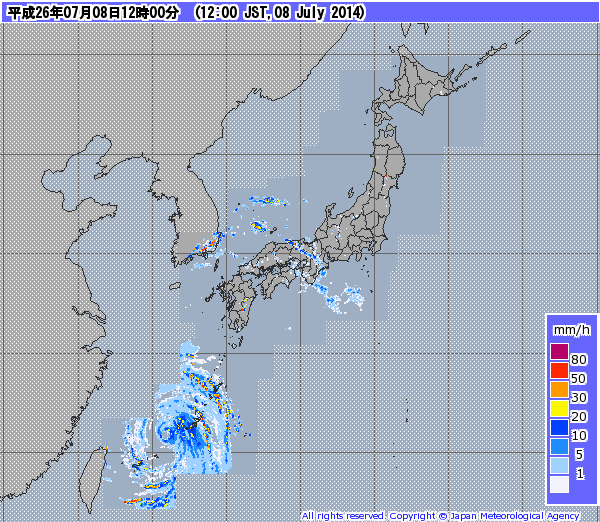
Radar observation (Nationwide)
Radar observation (Okinawa area)
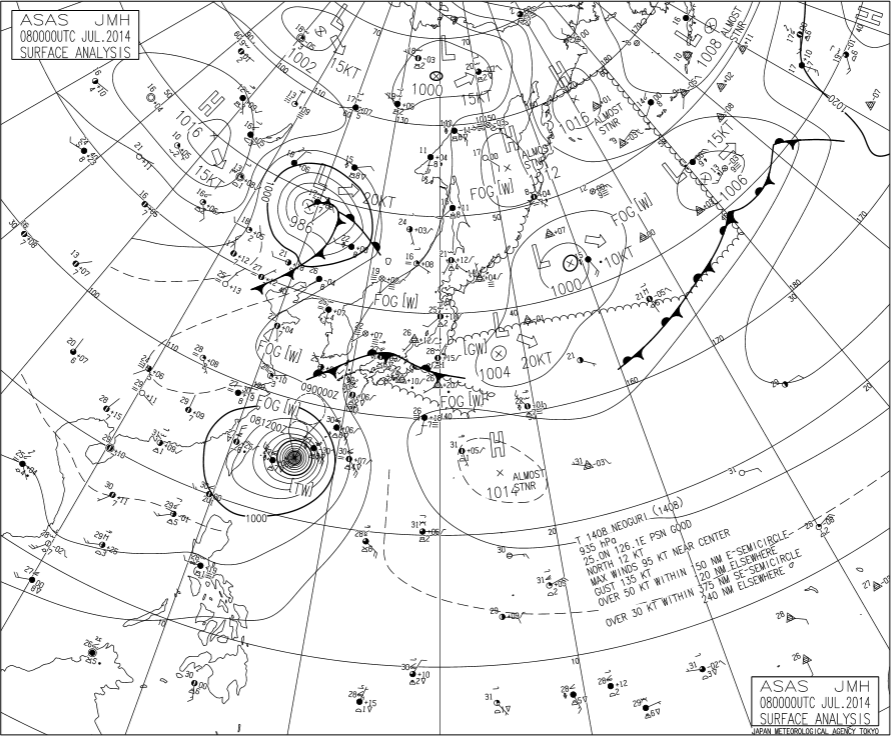
Weather map (9:00 JST)
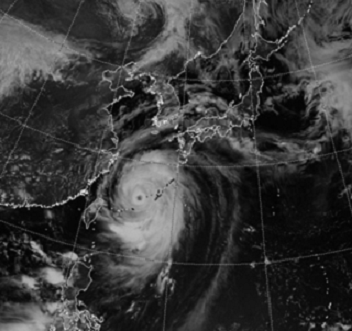
Satellite image
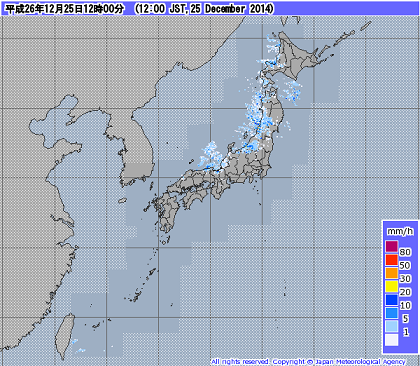
Streaky precipitation echo in winter (12:00 JST, 25 December 2014)
In winter, a cold dry northwestern monsoon from Siberia tends to blow over the Japanese archipelago. Its air mass absorbs water vapor and heat as it passes over the Sea of Japan, resulting in the formation of convective clouds and unstable atmospheric conditions. This is the main cause of the heavy snowfall observed in areas along Japan’s northwestern Sea of Japan coast in winter.
Much less precipitation is observed on the country’s Pacific Ocean side (i.e., on the opposite side of the mountainous backbone). The figures below show streaks of radar echoes (convective clouds) on the Sea of Japan side. In such cases, careful attention should be paid to the possibility of heavy snowfall.
Radar observation (Nationwide)
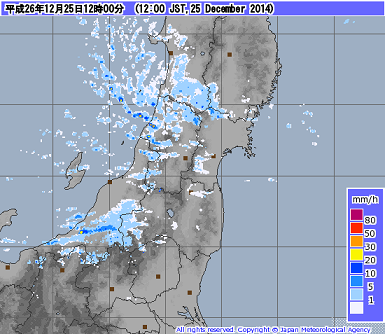
Radar observation (southern Tohoku area)
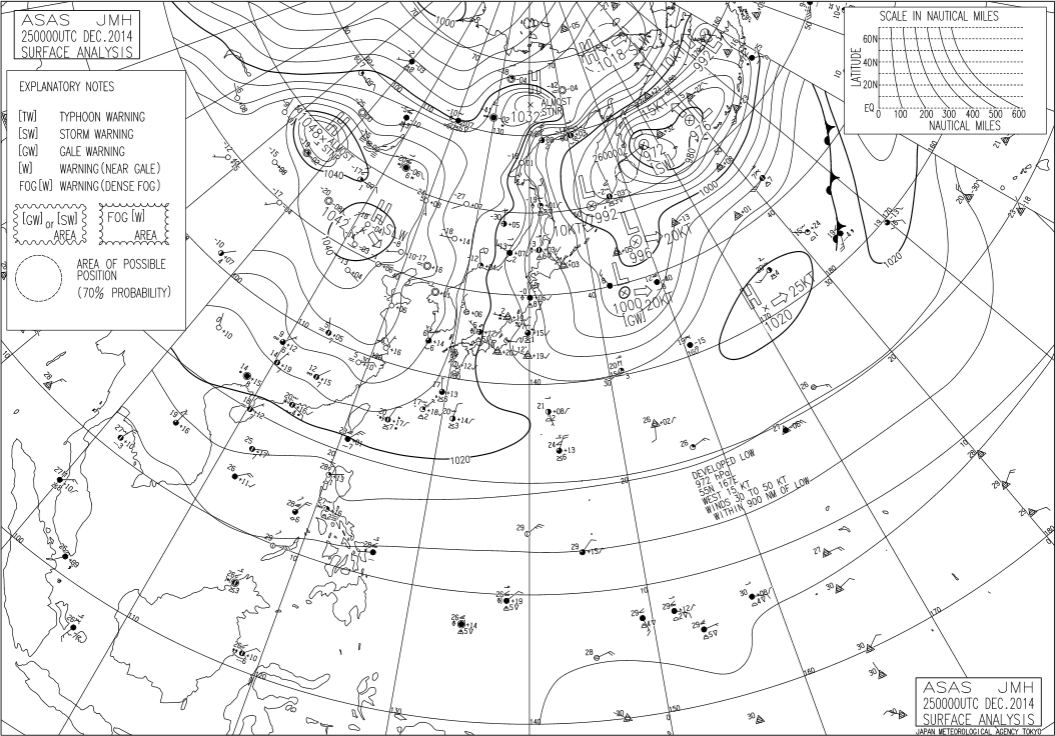
Weather map (9:00 JST)
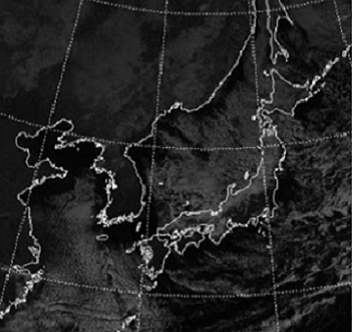
Satellite image
Notes on Weather Radar Usage
Weather radar is used to observe precipitation based on analysis of radio waves reflected by raindrops or snowflakes. However, false radar echoes sometimes appear in areas where there is no precipitation, and echoes can suggest much higher intensities than those of actual rainfall. Although data quality control is conducted to address such issues, errors can remain. Examples of problematic radar echoes are provided below.
Non-precipitation echoes
Echoes associated with abnormal propagation
Radio waves emitted by weather radars travel in a straight line and pass over mountains. However, they can also follow an abnormal propagation path depending on the spatial distribution of the atmosphere’s refractive index. Such waves may hit the earth's surface or land-based/marine structures, producing intense echoes in areas where there is no precipitation. These misleading echoes are inevitable due to the characteristics of radio wave-based observation, and cannot be completely eliminated in the quality control process.
The refractive index depends mainly on atmospheric temperature and humidity. Abnormal propagation occurs when this index varies greatly in the vertical direction; that is, when atmospheric temperature rapidly increases with altitude. This situation tends to occur in association with conditions such as atmospheric lowering of high-pressure systems, radiative cooling and advection caused by land/sea breezes. It should also be noted that stable atmospheric structures causing abnormal propagation readily form over flat oceanic areas.
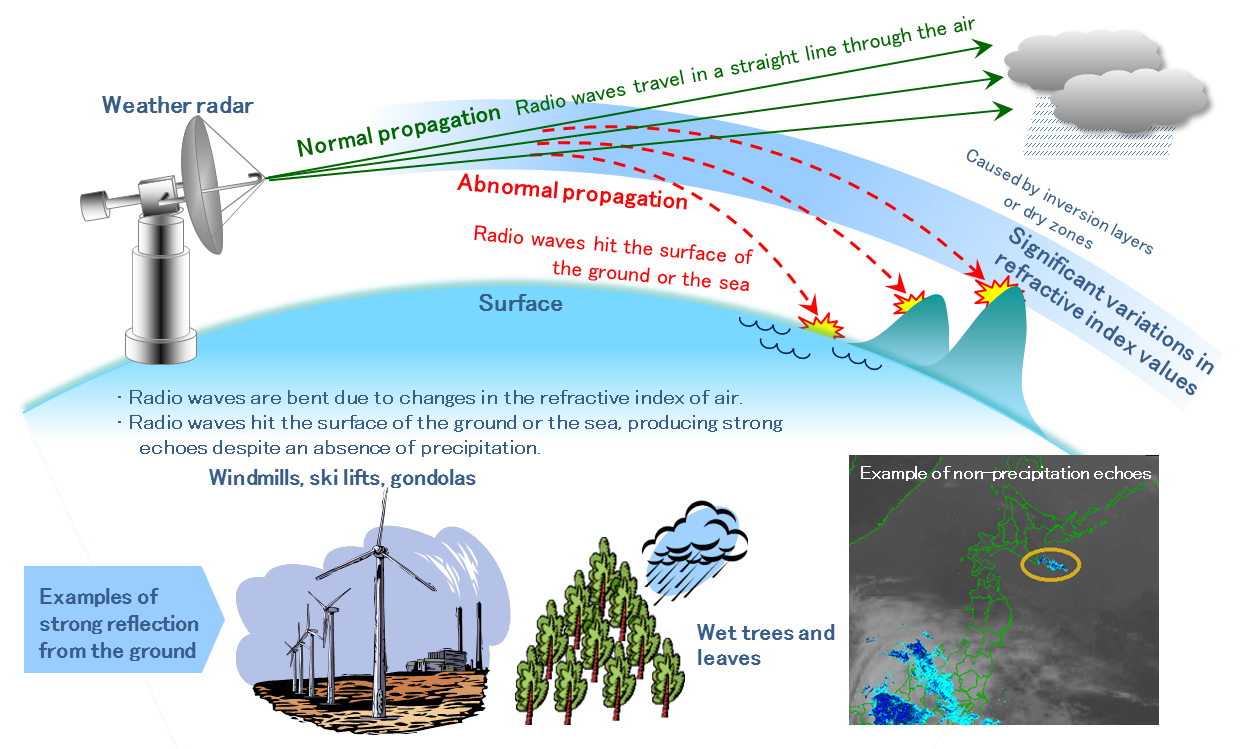
Abnormal propagation
Ground clutter
As described above, strong echoes appear when emitted radio waves hit the ground surface or structural objects in association with abnormal propagation. Problematic data caused by radio wave reflection from immobile surfaces such as the ground or fixed structures (known as ground clutter) can be distinguished from normal radar echoes produced by precipitation for removal in quality control. However, clutter data caused by moving objects such as trees swaying in the wind, large windmills or ski lifts cannot be eliminated completely.
Ground clutter
Sea clutter
Radio waves may also hit sea spray (known as sea clutter), especially when winds over the sea surface are strong. Sea clutter data are also difficult to remove in quality control processing.
Sea clutter
Echoes causing precipitation bright band overestimation
Snowflakes melt to become raindrops upon passing through the atmospheric layer at temperatures of 0 degrees Celsius and above. Sleet (a mid-state between snow and rain) with droplets larger than those of rain is covered with liquid water, and reflects radio waves more than liquid or solid particles (i.e., raindrops, snowflakes or hail). In addition, as larger particles reflect radio waves more, sleet reflects more than other kinds of precipitation.
Regions of sleet at temperatures of around 0 degrees Celsius are called melting layers. In such regions, echoes are locally stronger than those observed in the upper and lower layers (referred to as bright bands). If such melting layers exhibit horizontal spread, strong echoes are observed in an annular area centered on the radar along radar beams with specific elevation angles. In bright-band areas, precipitation amounts tend to be overestimated.
Bright band
Echoes causing underestimation of precipitation attenuation due to precipitation
Weather radars are used to observe precipitation intensity based on the intensity of radio wave reflection from precipitation particles (e.g., raindrops and snowflakes). When areas of significant precipitation are present along the path of radio waves (as shown in the figure on the left) or in the vicinity of radar sites, and/or if radomes (protective covers for antennas) are wet as a result of precipitation (as shown in the figure on the right), rainfall observation tends to result in underestimation due to the attenuation of radio waves.
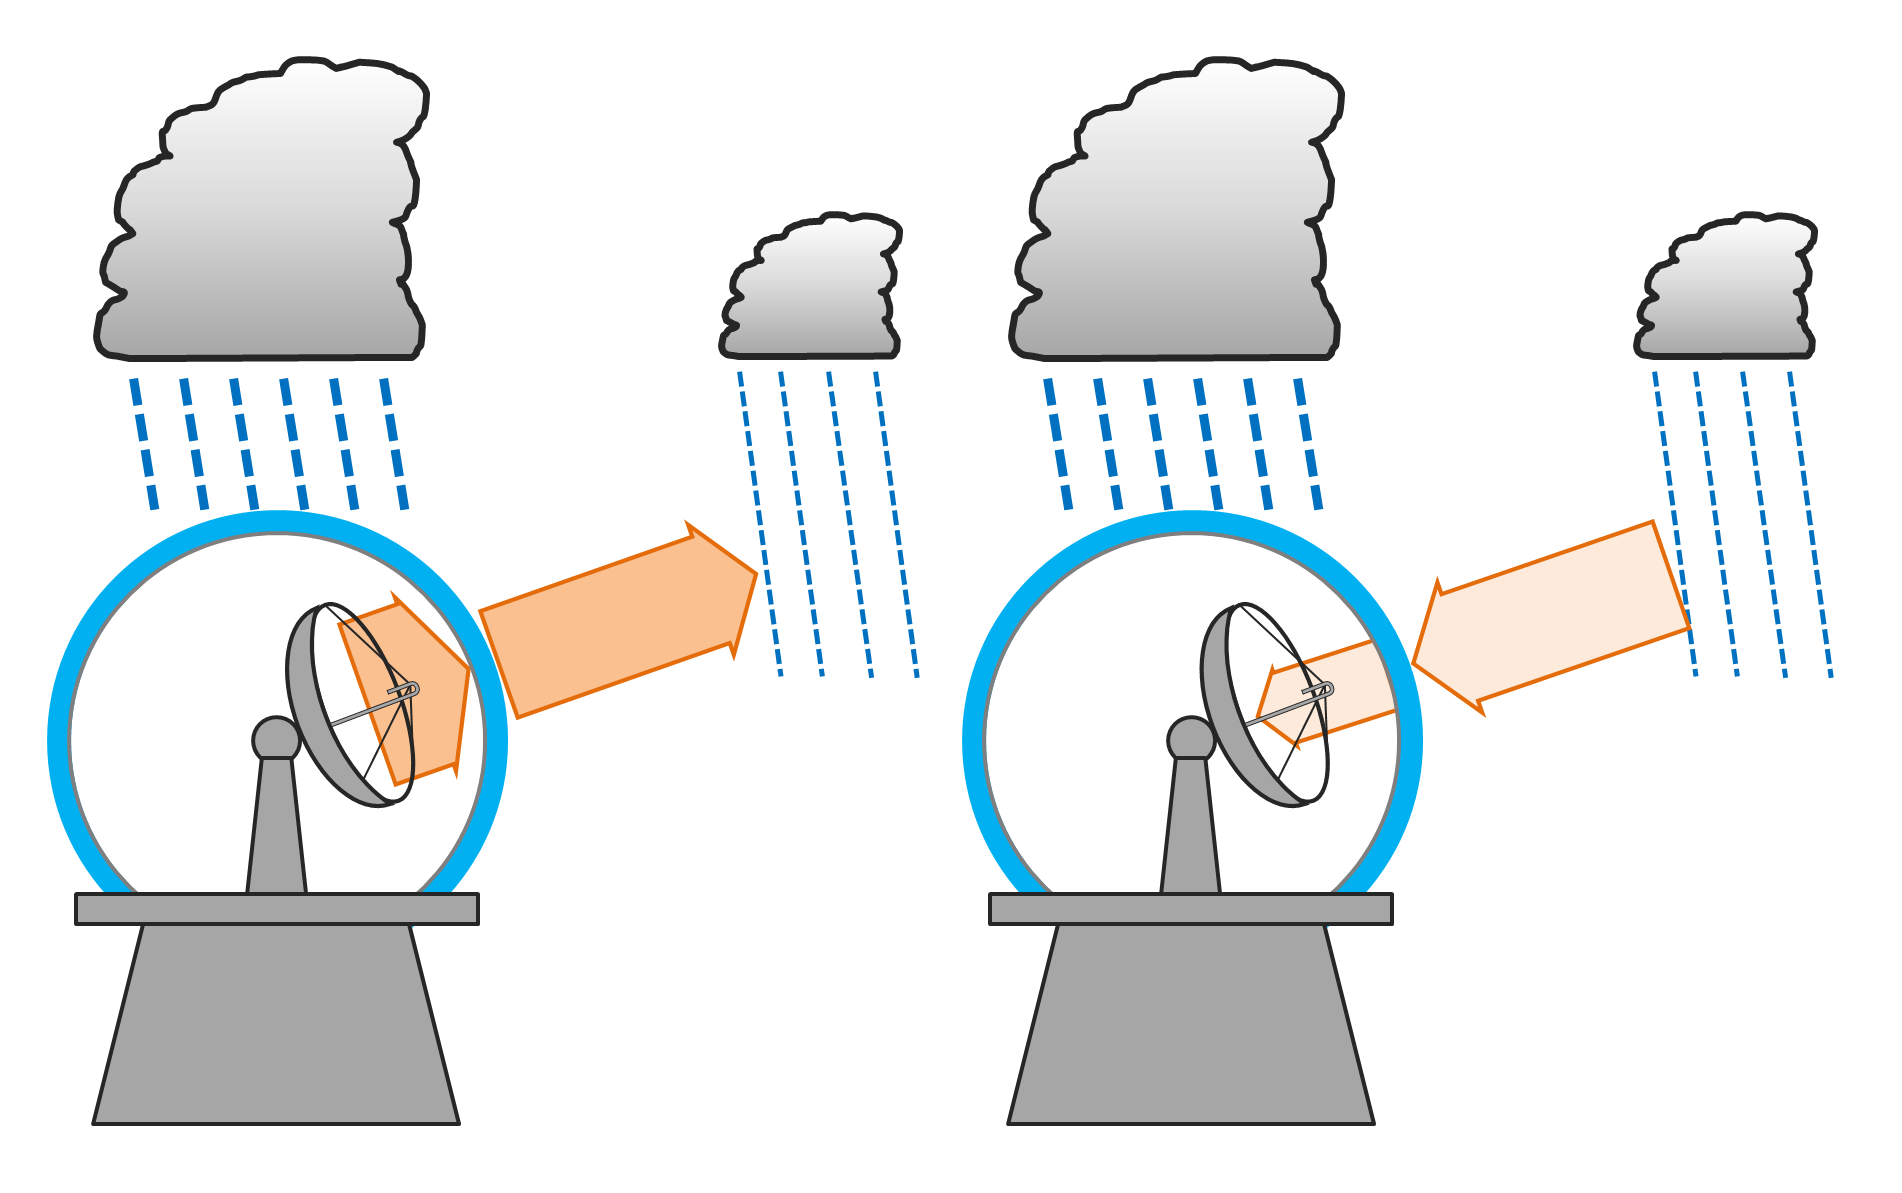
Attenuation due to precipitation
Left: heavy precipitation along the path of radio waves
Right: radome wetting as a result of heavy precipitation
JMA engages in day-to-day technical development to improve the accuracy of processes relating to quality management of radar observation data.