Radiosondes
Overview
Radiosondes are instruments used for meteorological observation. They are equipped with a platform of sensors that measure meteorological variables such as atmospheric pressure, temperature and humidity, and also have a radio transmitter for data communications.
A thermometer and hygrometer are attached to the unit's projecting arm, and a radio transmitter, battery and other parts are embedded in the body (a storage box made of white styrene foam). Some radiosondes have an embedded barometer for measurement of atmospheric pressure. Conversely, the GPS radiosondes used by the Japan Meteorological Agency (JMA) derive pressure from height based on GPS signals. These data are also used to evaluate wind direction and velocity.
Upper-air observation using radiosondes is carried out daily at regular intervals worldwide (at 0900 and 2100 JST). Radiosonde observation is conducted by JMA at 16 Local Meteorological Office stations nationwide and at Syowa Station in Antarctica, and on board JMA research vessels. Radiosonde data are utilized for numerical prediction models (providing basic information for weather forecasts), climate change/global environment monitoring, flight operation management and other purposes.
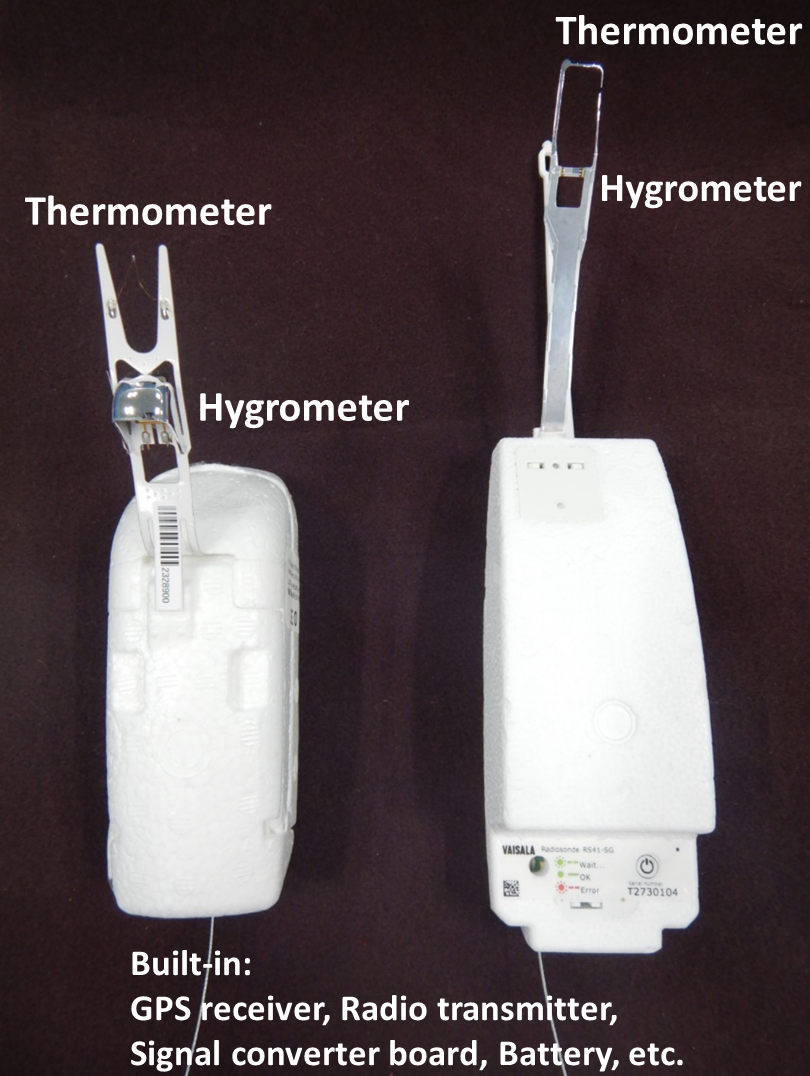
Radiosondes (from left: iMS-100, RS41-SG)
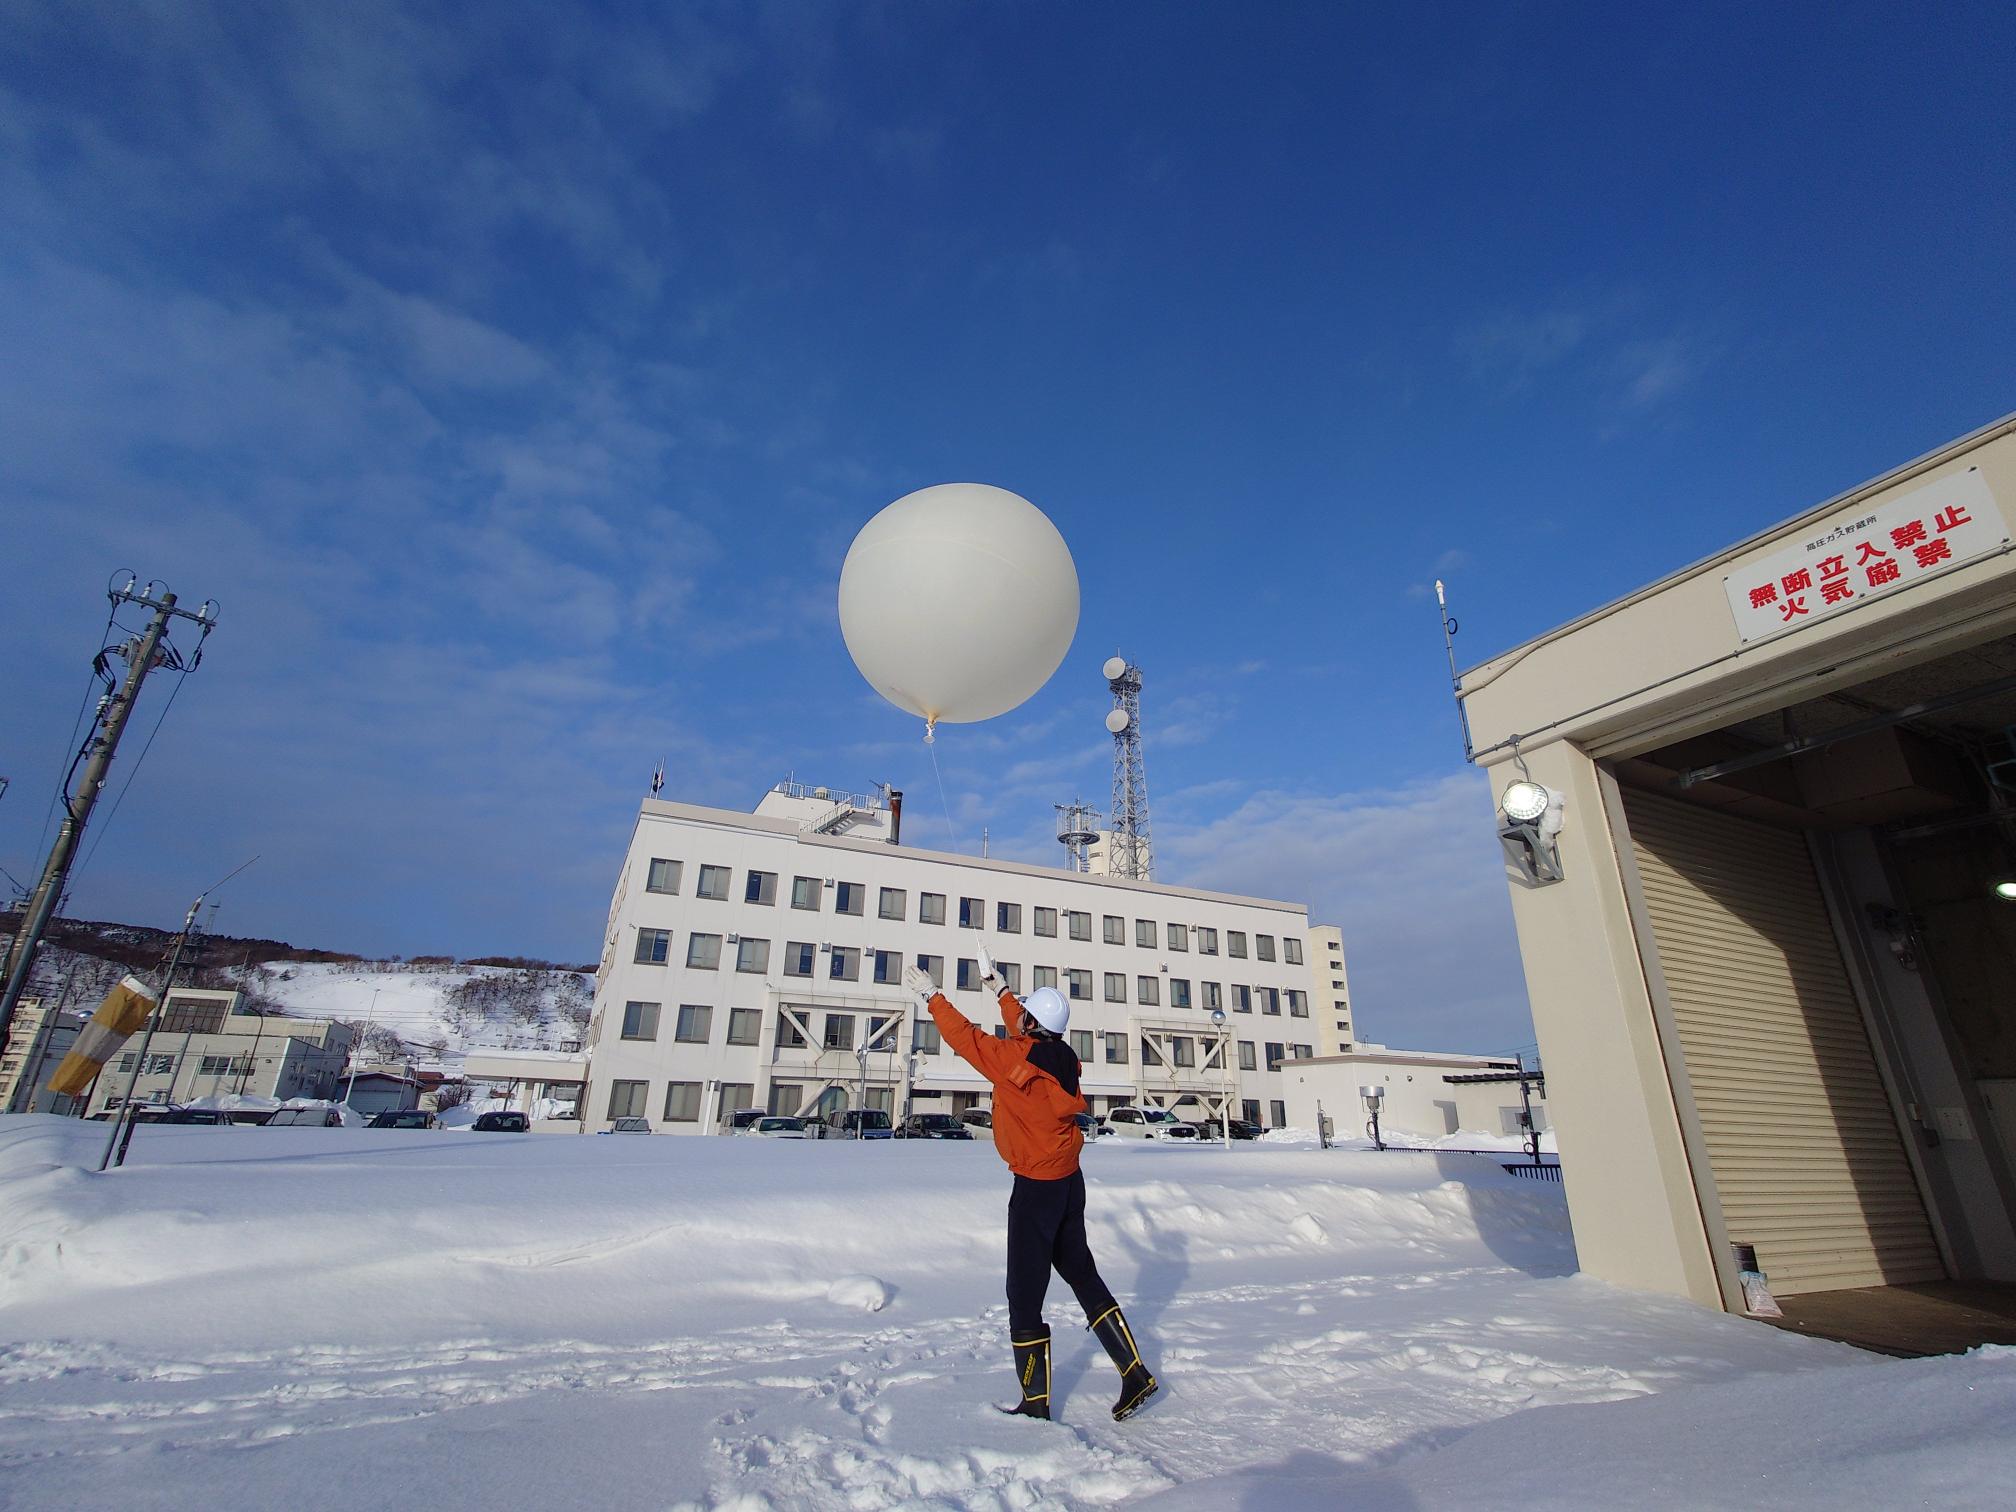
MBL: Manned Balloon Launching
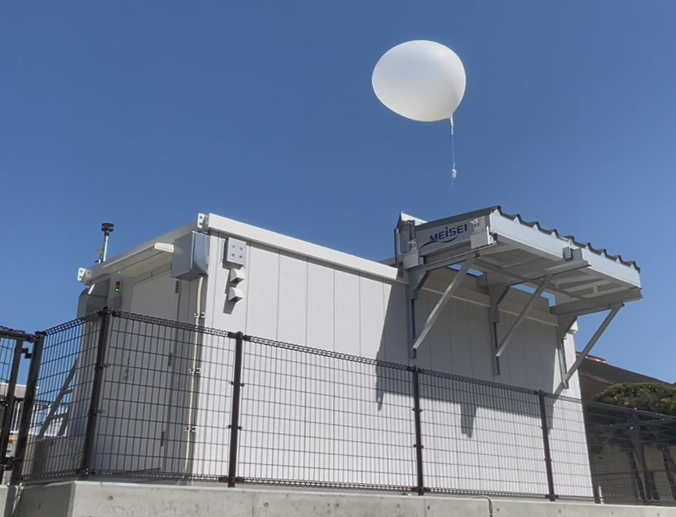
ABL: Automatic Balloon Launcher
Radiosonde Observation Sites
| Region ID | Station | Location | Latitude (degree) |
Longitude (degree) |
|---|---|---|---|---|
| 47401 | Wakkanai | Wakkanai-shi, Hokkaido | 45°24.9′ | 141°40.7′ |
| 47412 | Sapporo | Sapporo-shi, Hokkaido | 43°03.6′ | 141°19.7′ |
| 47418 | Kushiro | Kushiro-shi, Hokkaido | 42°57.2′ | 144°26.3′ |
| 47582 | Akita | Akita-shi, Akita | 39°43.1′ | 140°06.0′ |
| 47600 | Wajima | Wajima-shi, Ishikawa | 37°23.5′ | 136°53.7′ |
| 47646 | Tateno | Tsukuba-shi, Ibaraki | 36°03.5′ | 140°07.5′ |
| 47678 | Hachijojima | Hachijo-machi, Hachijojima, Tokyo | 33°07.3′ | 139°46.7′ |
| 47741 | Matsue | Matsue-shi, Shimane | 35°27.5′ | 133°04.0′ |
| 47778 | Shionomisaki | Kushimoto-cho, Higashimuro-gun, Wakayama | 33°27.1′ | 135°45.7′ |
| 47807 | Fukuoka | Fukuoka-shi, Fukuoka | 33°35.0′ | 130°23.0′ |
| 47827 | Kagoshima | Kagoshima-shi, Kagoshima | 31°33.3′ | 130°32.9′ |
| 47909 | Naze/Funchatoge | Amami-shi, Kagoshima | 28°23.6′ | 129°33.2′ |
| 47918 | Ishigakijima | Ishigaki-shi, Okinawa | 24°20.2′ | 124°09.8′ |
| 47945 | Minamidaitojima | Minamidaito-son, Shimajiri-gun, Okinawa | 25°49.8′ | 131°13.7′ |
| 47971 | Chichijima | Ogasawara-mura, Tokyo | 27°05.7′ | 142°11.1′ |
| 47991 | Minamitorishima | Ogasawara-mura, Tokyo | 24°17.4′ | 153°59.0′ |
| 89532 | Syowa | Syowa Station, Antarctica | -69°00.3′ | 39°34.7′ |
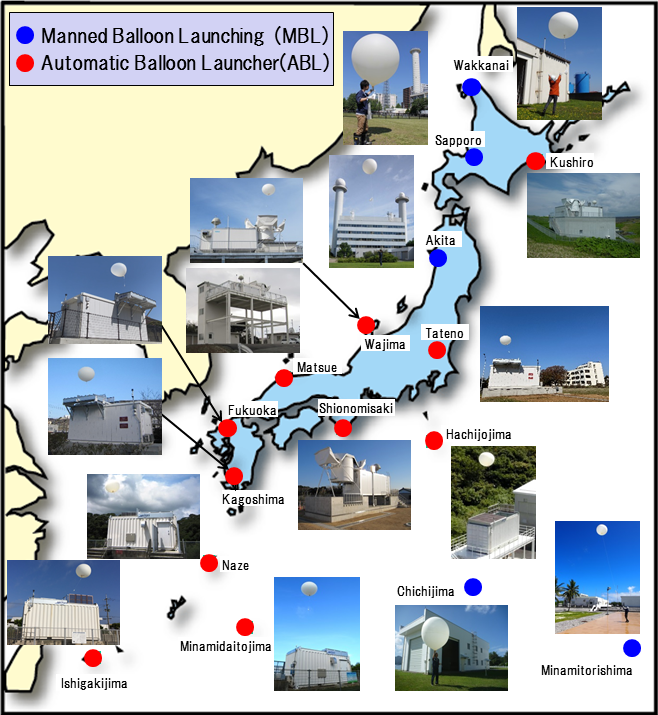
Radiosonde observation network (as of April 2023)
Observation Data
Data at specified pressure levels
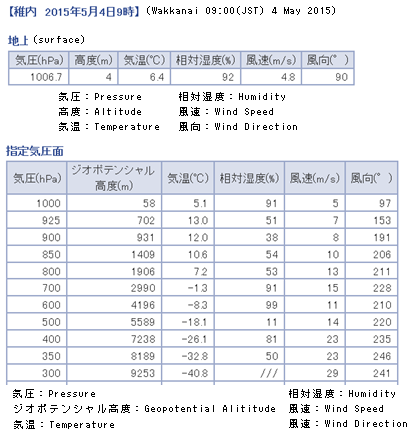
Left: partial observation data for specified pressure levels, Wakkanai, 9:00 JST, 4 May 2015
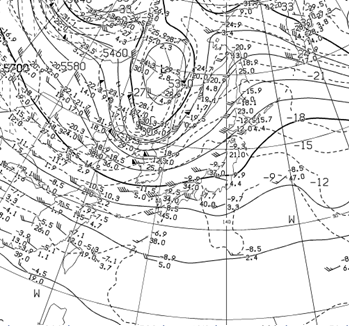
Right: weather map (500 hPa), 9:00 JST, 4 May 2015
Upper-air stability can be evaluated using observation data from radiosondes. "Atmospheric conditions are unstable" is an all-too-common term in weather forecasting; to evaluate actual stability, emagrams can be used as described below.
Emagrams
An emagram is a kind of graphic chart illustrating atmospheric temperature and dew point temperature in relation to atmospheric pressure. As shown in Figure 1, the horizontal axis of the chart represents temperature, and the vertical axis represents pressure. Dry adiabatic lines, wet adiabatic lines and equal saturation mixing ratio lines are represented on the chart for reference in evaluating atmospheric stability. Dry adiabatic lines represent the relationship between temperature and pressure of dry air mass, while wet adiabatic lines are for saturated air mass with water vapor. Equal saturation mixing ratio lines pass through the point where the weight of water vapor contained in saturated air is equal to that of air excluding water vapor. Atmospheric stability is evaluated by comparing observation data with these reference lines.
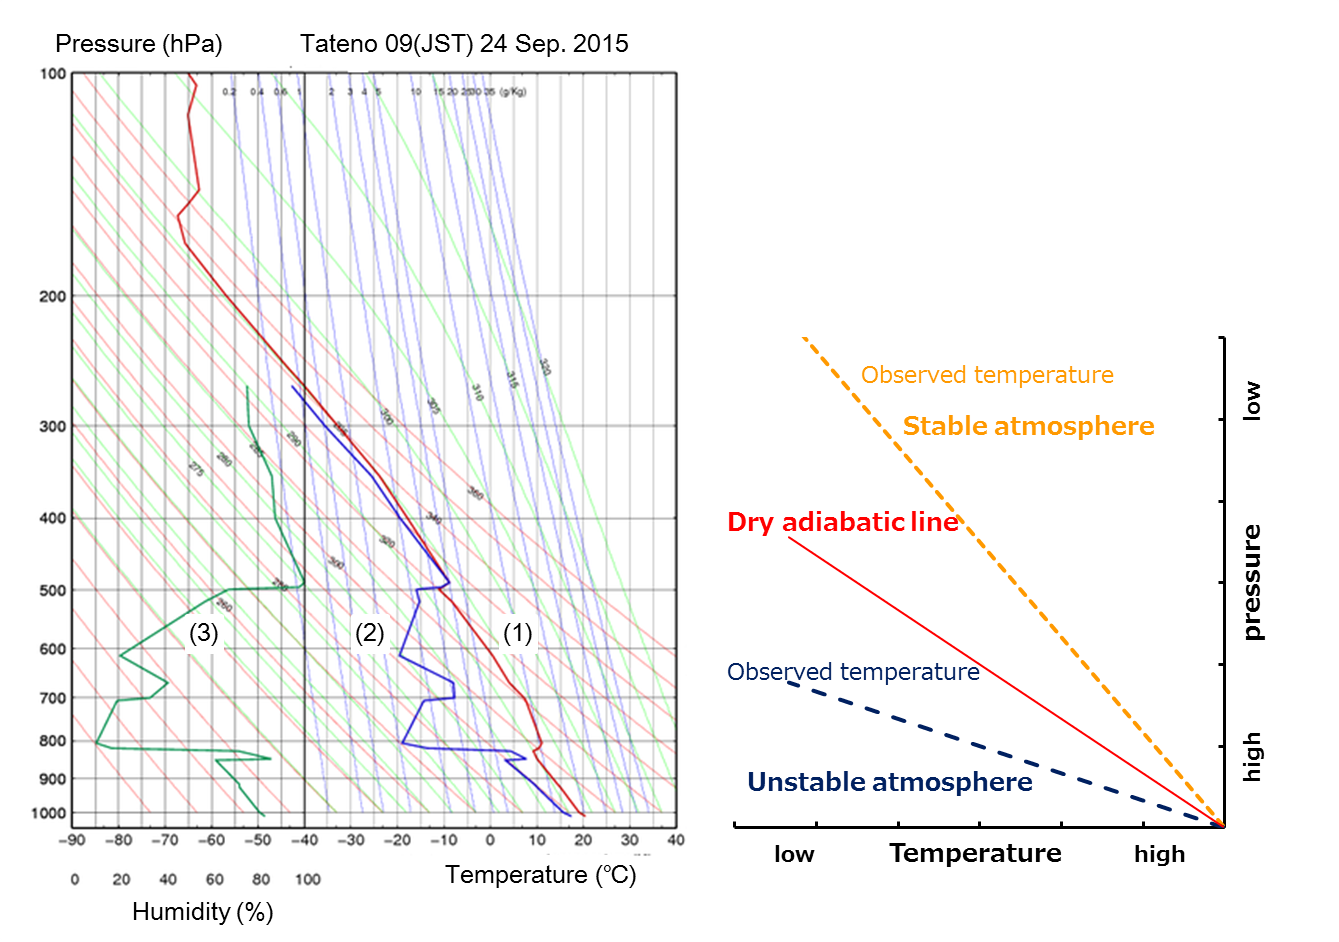
Figure 1 (left): upper-air observation (radiosonde) data from Tateno, 9:00 JST, 24 September 2015
Observation temperature data are shown by the thick red line (1). The thin red dry adiabatic lines show temperature changes
in the virtually lifted air mass near the ground surface. The blue line shows the dew point temperature (2), and the green line indicates humidity (3).
Figure 2 (right): emagram-based representations of atmospheric stability evaluation
In Figure 1, the dry adiabatic (thin red) lines show the temperature change of the virtually lifted air mass near the ground surface. Atmospheric stability can be evaluated by comparing observation (thick red line) data with the reference lines.
Comparison of the thick red line (1) and the thin red line passing through the surface temperature level at the same height shows a higher temperature for (1). This means that the temperature of the lifted air mass near the ground is lower than that of the surrounding environment. As cold air is heavier (denser) than the surrounding air, upward flow will not develop. This situation is referred to as atmospheric stability.
Figure 2 shows a diagram of emagram-based evaluation of atmospheric stability. The appearance of observation data below dry adiabatic lines (meaning that the lifted air mass is warmer than its surroundings) indicates the development of updraft due to buoyancy. In response to this situation, the comment "The atmosphere is unstable" is made. Torrential rain and a range of other weather phenomena brought by cumulonimbus clouds are more likely to occur under these conditions. Meanwhile, if the air mass is wet, the stability of the atmosphere should be evaluated using the wet adiabatic line. Wet atmospheric conditions are more likely to be associated with instability than dry conditions.