Meteorological Satellites -Japan Meteorological Agency (JMA)-
News Release
•Collection of images captured by Himawari-8 during In-Orbit-Test
Japan Meteorological Agency
1 May 2015
1 May 2015
Collection of images captured by Himawari-8 in the in-orbit commissioning phase. (Click an image to enlarge or animate.)
Comparison of spatial resolution between MTSAT-2 and Himawari-8
 |
03 UTC, 31 March 2015 Japan’s Kanto region Left: visible imagery from MTSAT-2 (spatial resolution: 1 km) Right: visible imagery from Himawari-8 (spatial resolution: 500 m) Clouds, coastlines and snow on Mt. Fuji are sharper in the Himawari-8 imagery.
[PNG: 140 kB]
|
Comparison of time resolution between MTSAT-2 and Himawari-8
 |
16 UTC, 2 April 2015 – 13 UTC, 3 April 2015 Full disk Left: visible imagery from MTSAT-2 (interval: 1 hour) Right: true-color composite imagery from Himawari-8 (interval: 10 minutes) MTSAT-2 captures monochrome images with one visible band, whereas Himawari-8 enables the creation of true-color imagery with three visible bands corresponding to red, green and blue.
Himawari-8 also helps to elucidate the movement and development of clouds because its full-disk observations are just 10 minutes apart as compared to 1 hour for MTSAT-2.
The light crossing the near-equatorial region is a reflection of sunlight from the earth’s surface, known as sun glint. [GIF: 40.3 MB]
|
 |
15 – 24 UTC, 3 April 2015 Japan area Left: infrared imagery from MTSAT-2 (interval: 30 minutes) Right: infrared imagery from Himawari-8 (interval: 2.5 minutes) Himawari-8 observes the area covering Japan and the surrounding area at 2.5-minute intervals. This high-frequency monitoring is expected to improve performance in the tracking of rapidly developing convection.
The Himawari-8 imagery here is irregularly shaped due to the planar projection of spherical earth images with latitude-longitude lattice coordinates. [GIF: 89.5 MB]
|
Volcanic eruption on the Kamchatka Peninsula
 |
22 UTC, 25 March 2015 – 04 UTC, 26 March 2015 Left: visible imagery from MTSAT-2 (interval: 30 minutes) Right: visible imagery from Himawari-8 (interval: 2.5 minutes) The red circles indicate a volcanic eruption on Russia’s Kamchatka Peninsula. Himawari-8 conducted regional scanning at 2.5-minute intervals in this region, producing imagery that shows the southerly distribution of volcanic ash more clearly than MTSAT-2 imagery taken at 30-minute intervals. [GIF: 97.1 MB]
|
Typhoon Maysak
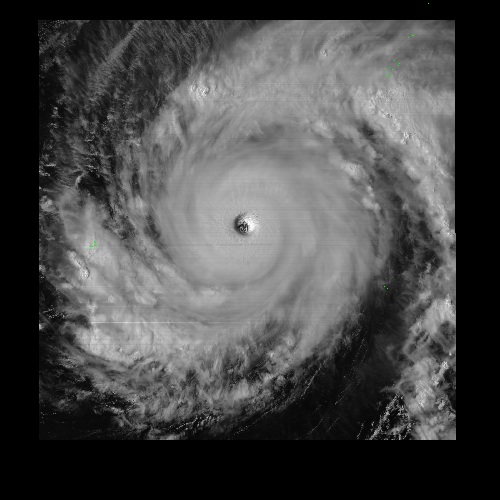 |
20:30 UTC, 30 March 2015 – 9 UTC, 31 March 2015 Visible imagery from Himawari-8 (interval: 2.5 minutes) Himawari-8’s observation area can be changed every 2.5 minutes. Once a typhoon forms, the satellite can follow it using this function. This image shows Typhoon Maysak with a clear eye and a surrounding eyewall. Active convective cloud bands are developing within the rotating typhoon system. Fractional low-level cloud swirling in the eye of the typhoon is observed. [WMV: 79.3 MB] You will need Windows Media Player to view it. Visit the Windows Media Player website
|
Yellow sand
 |
00 – 04 UTC, 22 March 2015 Left: visible imagery from MTSAT-2 (interval: 30 minutes) Right: true-color composite imagery from Himawari-8 (interval: 10 minutes) It can be difficult to distinguish yellow sand from cloud in MTSAT-2 monochrome imagery, but not in Himawari-8 true-color composite imagery. Yellow sand is seen floating southward over the Yellow Sea here. [GIF: 29.9 MB]
|
 |
00 – 04 UTC, 22 March 2015 Left: visible imagery from MTSAT-2 (interval: 30 minutes) Right: RGB composite of visible and near-infrared imagery from Himawari-8 (interval: 10 minutes) The reflective characteristics of yellow sand differ from those of clouds in visible and near-infrared bands. It is therefore possible to identify yellow sand in images with emphasis created through the composition of the three related bands into RGB composite imagery. Himawari-8 RGB composite imagery (right) enhances sand in brown, clouds in white and cyan, vegetation in green and the sea in rich blue. The yellow sand over the Yellow Sea is more clearly visible here than in true-color composite imagery. [GIF: 33.7 MB]
|
Eruption of Sakurajima
 |
11 – 16 UTC, 23 January 2015 Left: infrared imagery from MTSAT-2 (interval: 30 minutes) Right: infrared imagery from Himawari-8 (interval: 2.5 minutes) Himawari-8 images taken at 2.5-minute intervals facilitate monitoring of volcanic ash ejection more than MTSAT-2 images taken at 30-minute intervals. [GIF: 40.6 MB]
|
 |
11 – 16 UTC, 23 January 2015 RGB composite made with infrared imagery from Himawari-8 (interval: 2.5 minutes) Himawari-8 enables highlighting of volcanic ash in bright pink based on differences in radiative characteristics between volcanic ash and clouds in terms of infrared wavelength. [GIF: 59.3 MB]
|
Ice in the Sea of Okhotsk
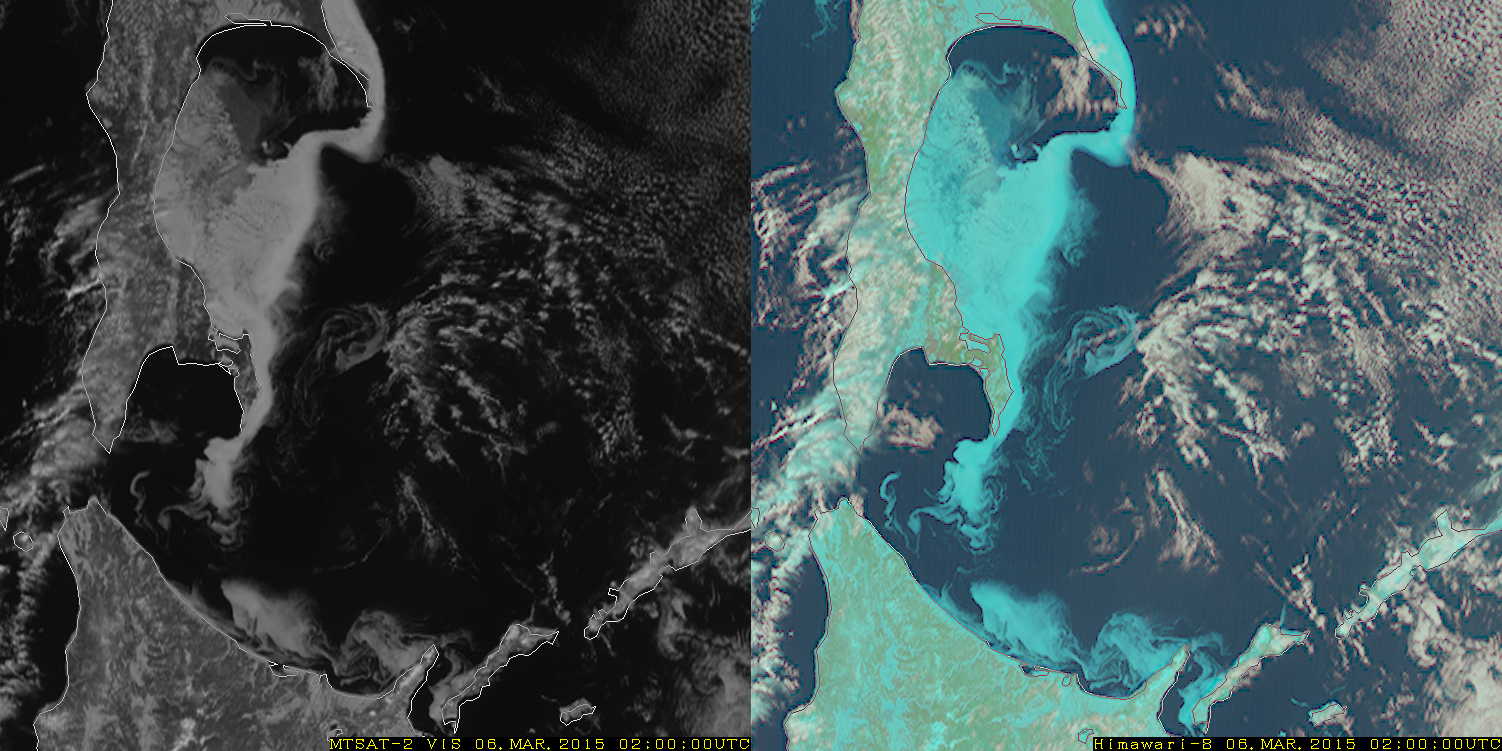 |
02 UTC, 6 March 2015 Left: visible imagery from MTSAT-2 Right: visible and near-infrared RGB composite imagery from Himawari-8 The reflective characteristics of sea ice differ from those of clouds in visible and near-infrared bands. It is therefore possible to identify sea ice in images with emphasis created through the composition of the three related bands into RGB composite imagery. It can be difficult to distinguish sea ice from clouds in MTSAT-2 monochrome imagery. The Himawari-8 RGB composite imagery on the right enhances clouds in white and sea ice in cyan, and shows the exact distribution of sea ice near the Sea of Okhotsk coast. [PNG: 1.4 MB]
|
Satellite Program Division, Japan Meteorological Agency
E-mail: metsat AT met.kishou.go.jp